Most companies that invest in collecting customer feedback stop short of the harder work: analyzing what they collected, deciding what it means, and acting on it in a way they can measure.
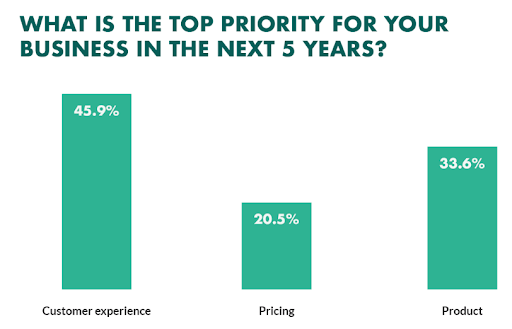
Collecting feedback from customers is a job half-done. The analysis of feedback data is what makes all the difference in customer experience.
So, why do some companies fail to listen to the customers when they invest resources in collecting feedback? – It’s their struggle with customer feedback analysis.
Some may not realize the importance of analyzing the collected data to procure actionable insights, and some may not have or be aware of the resources to use for this task.
So, if you’re one of them, it’s your lucky day.
This guide covers the full cycle, from identifying quality sources and cleaning data to choosing the right analysis method for your volume and validating that what you fixed actually moved a metric.
Let’s take it from the top.
Customer Feedback Analysis: A Definition
Customer feedback analysis includes looking into qualitative and quantitative feedback data and exploring actionable and valuable insights. Different methods for the analysis of customer feedback consist of different stages.
For example, a manual customer analysis process will consist of two stages:
- Categorizing customer feedback
- Analyzing each category individually to make sense of the data
On the other hand, using a feedback analysis tool will automate the process, and you’ll only have to analyze the reports prepared by the tool.
Note*
The customer and user distinction is worth understanding, but it is not always a clean separation.
In many SaaS, B2C, and DTC contexts, the person who pays and the person who uses the product are the same individual, and customer feedback and user feedback methods overlap significantly.
Where the distinction is useful: in enterprise B2B software, the economic buyer (the customer who signs the contract) and the end users (employees who use the product daily) often have different feedback priorities.
The buyer cares about ROI, implementation risk, and vendor reliability. The user cares about task efficiency, interface clarity, and support quality. Running the same survey to both groups and treating the responses as equivalent will produce misleading data.
Where the distinction is less useful: for consumer products, self-serve SaaS, and most e-commerce businesses, trying to separate “customer feedback” from “user feedback” as distinct programs adds complexity without corresponding value.
The practical rule: decide at the start of each feedback initiative whether you are trying to understand the purchasing and relationship experience, the product usage experience, or both, and design your questions accordingly rather than applying a fixed customer vs. user label.
How to Differentiate Insightful Data From Non-Insightful Data?
Following Kevin Malone’s train of thought, let’s understand this in simple and few words.
Insightful data is the information that’s new and useful to your business. These are the actionable insights your team can leverage to create strategies and processes that ultimately grow your business and make your customers happy.
There are different types of insightful data:
- One that you use for validating the hypothesis
- One that motivates critical thinking and leads you to perform actions
- One that helps you reshape your strategies
On the other spectrum is the non-insightful data which doesn’t add value to your customer’s perspective.
Example:
Say you deploy an NPS survey with these follow-up questions:
- for detractors, “Can you please tell us what you did not like in the product?”
- for promoters, “Please tell us what you liked in our tool.”
Now, with these questions, this kind of feedback is non-insightful:
Detractors: Feedback like “I don’t like the product,” “I had a hard time using the product,” etc., is not helpful since you already know these customers are unsatisfied because of their score.
You need to focus on the specific feedback that tells you the reason behind their score, such as “I had a hard time using the ZYX feature.”
Promoters: Feedback like “I love using the product,” “This is one of the best tools,” etc., does not tell you what is working for these customers.
It is general information that doesn’t offer a score for improvement or action. So, insights such as “I love the XYZ feature; it made it easy to do ABC tasks” and “I like the UI of the product” are your valuable assets.
Since you now know the data you need to focus on to derive positive results, let’s look at the rich sources of customer feedback you can leverage to collect data for your business.
7 Quality Sources to Collect Data for Customer Feedback Analysis
You now know what to look for and why to look for it. Let’s find out where to look for it.
1. In-App and on-Site Feedback Surveys
Online surveys such as long-form, one-question, and pop-up surveys are great ways to ask customers about their experiences and preferences and analyze their online behavior based on responses.
Various kinds of surveys to leverage for your business by deploying on your website and mobile app are as follows:
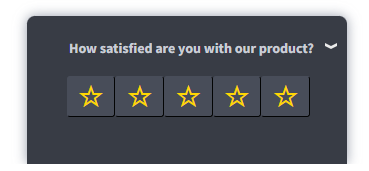
Customer Satisfaction Surveys (CSAT)
Customer satisfaction surveys are one-question surveys that you can use to gauge the satisfaction level of your customers regarding your services, products, and overall experience.
Some question examples:
- How satisfied are you with our product?
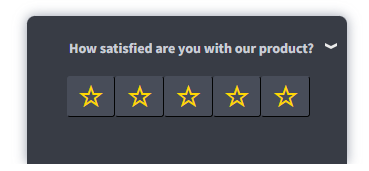
- How would you rate your experience using our website?
- How would you like to rate the support you received?
- Was the support representative able to resolve the issue?
Useful read: Here are a few more customer satisfaction survey questions to help you create delightful surveys.
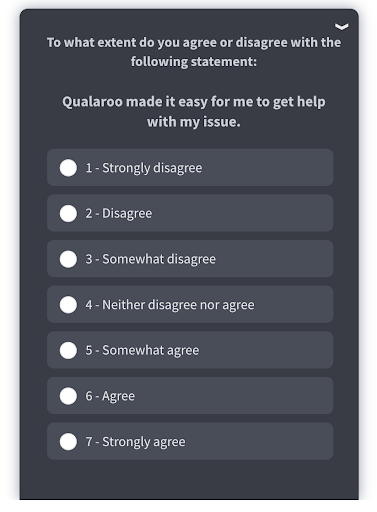
Customer Effort Score Surveys (CES)
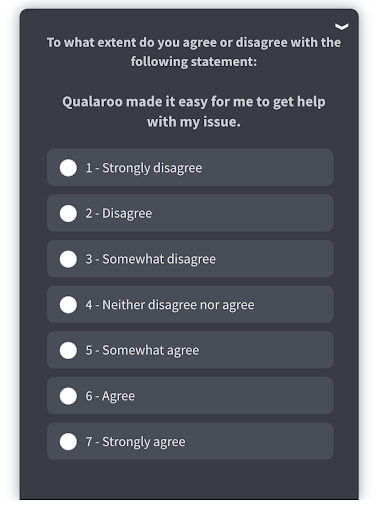
The Customer Effort Score is a metric that you can use to understand how easy or difficult a task was for customers. In other words, it helps gauge the level of effort customers had to put into accomplishing a goal.
Question example:
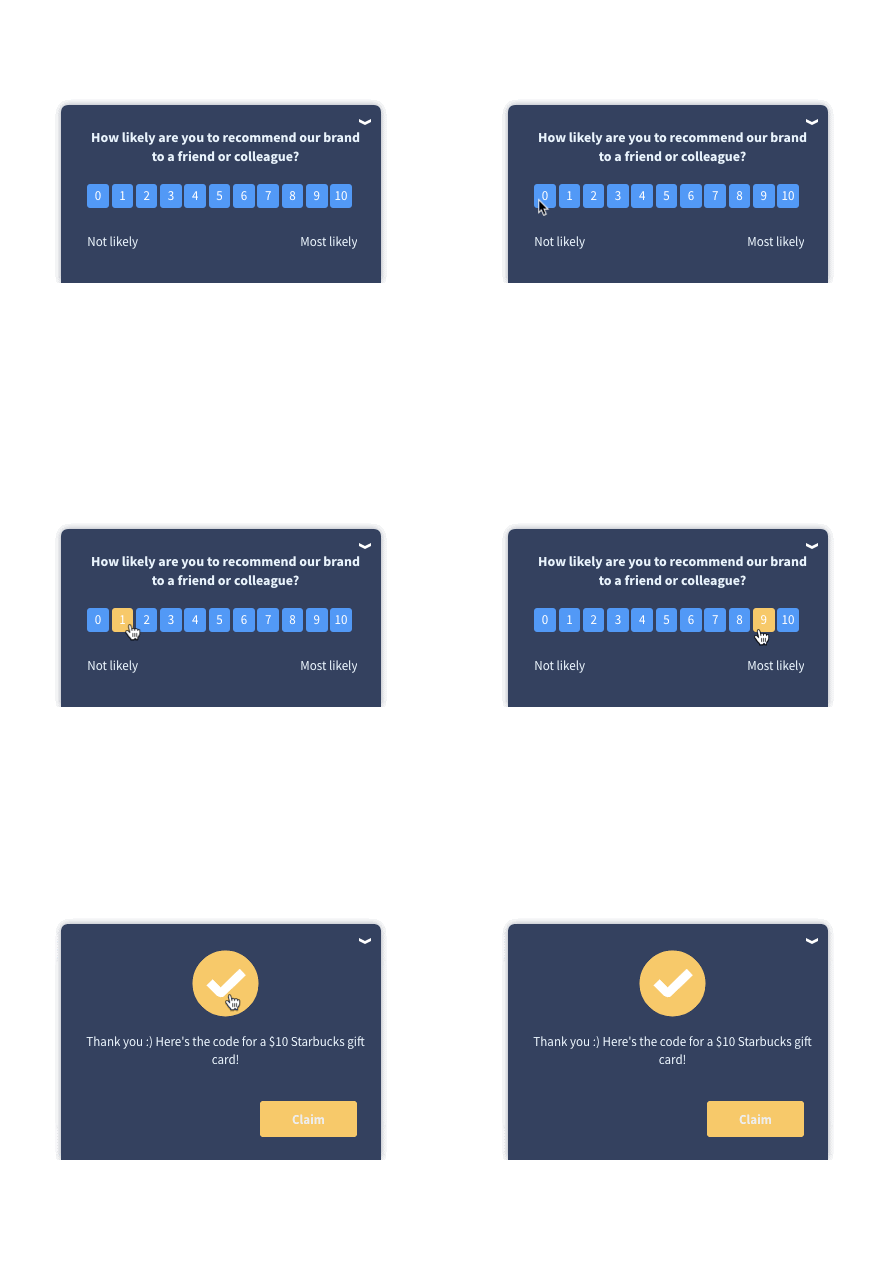
NPS surveys are popularly used by businesses as they differentiate promoters from detractors. It’s a customer loyalty metric that is definitely worth tracking.
A higher NPS signifies that you have more loyal and happy customers than disloyal and unhappy ones.
This survey consists of a simple question:
“How likely are you to recommend our services/products to your friends and family?”
System Usability Scale Surveys (SUS)
SUS surveys are great for collecting customer feedback for your software products. You can ask customers what they think about the product’s performance, features, etc.
Some question examples:
- I found the [website/ product/ tool/ software] to be complex.
- I thought the [website/ product/ tool/ software] was easy to use.

Marketing Surveys
You can use marketing surveys to explore the channels your customers come from. With feedback from these surveys, you can effectively focus on the marketing channels that bring more traffic to your website and more prospects to your business.
Survey question example:

Case Study: Udemy
Udemy is an online learning platform that wanted to explore how the customers found out about them. For this, the team at Udemy leveraged customer feedback software Qualaroo’s pop-up marketing surveys to ask the customers while they were active on the website.
From the responses they got from the survey, they shortlisted the marketing channels that were profitable and re-allocated funds to these channels.
2. Customer Reviews: In-App and on-Site
So far, we’ve been discussing how customer feedback is vital for business growth, and customer reviews are a rich source for it.
You should watch out for insightful comments if you have added a comment section on your website pages and mobile apps.
You can also find authentic customer reviews on third-party review sites such as Reddit, Capterra, Quora, SoftwareSuggest, Gartner, FinancesOnline, PCmag, etc.
You can also leverage feedback collection tools that fetch customer feedback related to your product/brand from the internet and compile them into one place.
3. Social Media
It’s safe to say that nothing is more influential than social media in this digital age. Almost all the influential brands are on at least a few social media platforms, and for all the right reasons.
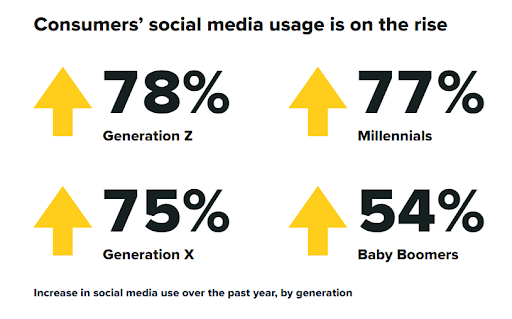
According to a report where some executives were surveyed, almost 72% of respondents said that social data is the most crucial data source for businesses, as it should be.
Why? Because consumers are active on these platforms now more than ever.
4. Emails and SMS
Email surveys are still a popular source to collect feedback from customers. Unlike website surveys, email surveys are more flexible since customers can take them anytime. They are also an excellent tool for improving customer engagement.
Coming to SMS surveys, these still enjoy a remarkable open rate of 98%, which is only 25% for email surveys. You can use SMS surveys post-interaction or post-service to get quick responses.
5. Live Chat
Offering live chat on a website or mobile app has many benefits for businesses, and customer feedback is one of them.
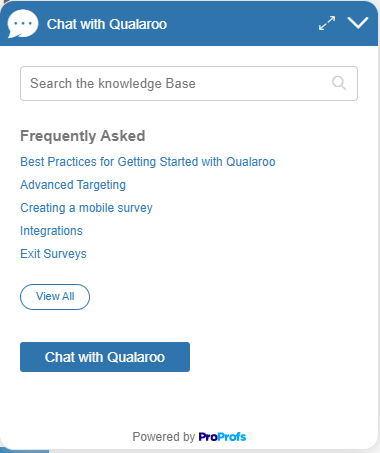
Since 92% of customers prefer live chat over some other channels, it’s a great platform to not only improve the engagement metrics but also collect customer experience data.
Tools such as ProProfs Chat allow you to add surveys to the chat session to ask customers about their experience.
We have the perfect guide for you You can also leverage other support tools like a knowledge base and Helpdesk software to obtain various insights to perform customer feedback data analysis.
6. Support Call Transcripts
Apart from live chat support, a big chunk of feedback data comes from customer call recordings.
Customers with grave issues and concerns opt for call support, where they leave indispensable actionable insights.
You can tap into this data using tools such as Chorus, Gong, etc., and get started with customer review analysis. Feedback from this source contributes heavily to user research and market research.
7. Feedback Forms
Many businesses launch slide-in feedback forms instead of pop-up surveys. It’s just a matter of preference and how you’ve planned your customer experience strategy.
Slide-in feedback forms are like a CTA button that remains static on the website and shows a feedback survey when visitors click. These are often placed on the right side near a live chat tool.
Since these feedback forms remain on the website as long as visitors, there are better chances of getting responses from these forms.
Although pop-up surveys are non-intrusive and smooth, they disappear once customers close the pop-up. But with feedback forms, customers can offer their insights whenever they want.
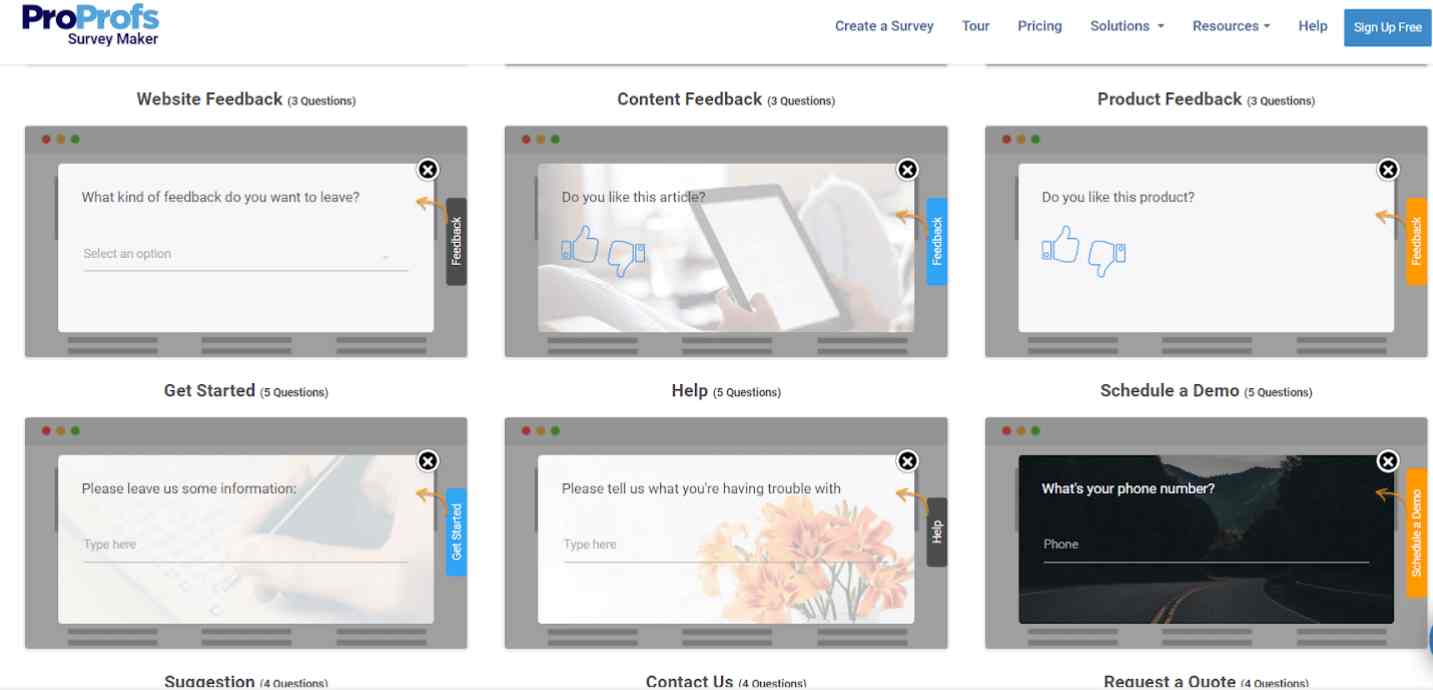
Multiple tools such as Proprofs Survey Maker enable you to create feedback forms to add to your website or mobile app.
You can also refer to our detailed article on “13 ways to collect customer feedback for your website” to dive deeper into each point.
Note*
You can also benefit from our take on the ‘12 Types of Survey Methods & How To Choose The Right One’. We’ve discussed the best methods to collect customer feedback with their pros and cons and what parameters to consider to choose the right method for your business.
Watch: How to Collect Customer Feedback
4 Methods to Analyze Customer Feedback
Now that you know where to get quality feedback, let’s discuss the customer feedback analysis methods. There are four ways to perform feedback analysis. Let’s discuss each one in detail and see which one suits your business.
Before choosing an analysis method, it helps to understand that not all feedback data is the same type, and different types require different analysis approaches.
Structured data includes survey ratings, scale scores (NPS, CSAT, CES), and multiple-choice responses. It is immediately quantifiable, can be tracked over time as a metric, and analyzed with standard statistical methods. Its limitation is that it tells you the score, not the reason behind it.
Unstructured data includes open-ended survey responses, support ticket text, review comments, social media posts, and call transcripts. It contains the richest explanatory content but requires qualitative coding, NLP, or AI-assisted analysis to process at scale. It cannot be averaged or trended in the same way as ratings data.
Behavioral data (heatmaps, session recordings, clickstream data) is a third category. It is neither solicited nor text-based. It shows what customers do rather than what they say, and it requires different tools and interpretation methods than both survey ratings and open-ended text.
The analysis methods below apply primarily to structured and unstructured survey data. Behavioral data analysis is a separate discipline with its own toolset.
1. Manual Customer Feedback Analysis
Manually analyzing your feedback involves strategizing and a lot of steps. This process requires coding knowledge to segregate and categorize the feedback and then create readable reports for analysis.
Steps to perform manual customer feedback analysis:
- Start collecting feedback from different channels as discussed in the above section, i.e., surveys, customer reviews, call transcripts, etc.
- Organize feedback data from these channels into one place. It could be an excel sheet or dedicated software that can fetch feedback and centralize it in one place.
- On a different excel sheet, you need to start categorizing your unclassified feedback as positive, negative, and neutral.
- Divide the categorized feedback into themes and sub-themes. For example, the feedback themes for an E-Commerce website would look something like this:
- Refund issues
- Product information
- Delivery issues
- Packaging
- Product quality
- Product sizing, and so on
Perform a root cause analysis with codified taxonomy (hierarchical tagging taxonomy) that will help you further categorize your feedback. Doing so helps you identify actionable opportunities. For example, let’s take the example of Qualaroo. Here’s what the whole process of categorization and codifying taxonomy would look like:
- 6. Based on the feedback you receive, you need customer feedback analysis visualization to make sense of the data and drive actionable insights. You can create reports in the forms of bars, charts, graphs, etc., based on category frequency, time series, and more.
A few steps that most guides skip but that determine whether manual analysis produces reliable output:
Data Cleaning Before Coding: Remove duplicate submissions, incomplete responses under a minimum word threshold, and bot-pattern entries before you begin categorization. Dirty data produces misleading theme frequencies.
Coding Quality and Intercoder Reliability: If more than one person is tagging feedback, check whether they are applying the same tags to the same types of responses. A simple spot-check method: have two analysts independently code the same 50 responses and measure agreement. If agreement is below 70%, your taxonomy needs tighter definitions before you scale.
Theme Validation: A theme that appears in 3% of responses from a vocal segment is not the same as one appearing in 30% across a representative sample. Before escalating a theme to a decision, check whether it holds across different customer segments, channels, and time periods.
Root-Cause Analysis After Categorization: Categorizing feedback tells you what customers are saying. Root-cause analysis tells you why. For each high-frequency theme, ask: Is this caused by a product gap, a communication failure, a process bottleneck, or an expectation mismatch? The category label does not tell you this. The verbatims and the operational data behind them do.
Who Should Opt for It: Manual analysis is feasible for small-to-medium businesses with a contained feedback volume, typically under a few hundred responses per cycle. Beyond that, the time cost and consistency risks outweigh the benefits.
2. Customer Feedback Analysis Using a Script
The script is a code snippet that you can customize with keywords you want to target in your feedback. It fetches feedback data with those keywords and automates going through the feedback manually.
Programs like Rake and Kea offer existing keyword extraction scripts that you can use for your business.
You can also use Qualaroo’s script to collect feedback and customize the “identifier” tag with the keywords you want the data for.
For example, you can collect targeted responses from respondents from a specific browser by adding “Browser” in the tag.
<script type=”text/javascript” charset=”utf-8″>_kiq.push{[‘identify’,’browser’]};</script>
Who should opt for it:
This customer feedback analysis method is suitable for mid-sized or large companies with the resources to dedicate a developer to prepare a tailored script.
3. Use Third-Party Feedback Analysis Tools
Instead of dedicating a team of developers to analyze feedback manually or through a script, you can go for an easy option and opt for analytics software.
Tools such as Power BI and Tableau are great choices to automate your customer feedback analysis process.
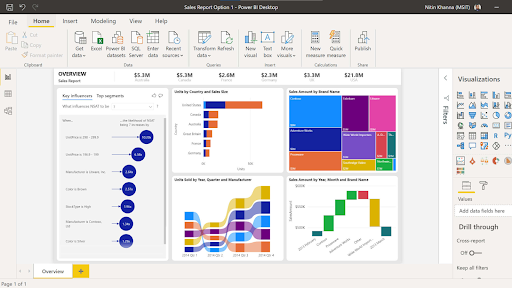
All you need to do is feed your customer data from your CRM into these reporting tools, and they will create insightful reports. They offer Excel integration and hundreds of feedback data visualizations.
Who should opt for it:
This method is viable for mid-size or even large businesses with large data sets to analyze.
4. Automate Customer Feedback Analysis With Artificial Intelligence
One of the most facilitated and popular customer feedback analysis methods is using AI-powered analytics tools. These tools turn your quantitative data into actionable, qualitative insights.
These tools take care of all the steps you have to perform in manual analysis, saving a significant amount of time, resources, and effort. They sort through a myriad of data points and categories in real-time to give you valuable insights.
The AI-powered tools leverage NLP and machine learning to analyze open-ended feedback and create visual reports.
The current generation of AI-assisted analysis goes significantly beyond keyword tagging and basic sentiment scoring. Three approaches worth understanding:
Semantic clustering groups responses by meaning rather than exact keyword match. A response saying “I couldn’t figure out the pricing page” and one saying “the plan comparison is confusing” will cluster together even if they share no keywords. This matters because manual tagging misses synonymous complaints unless analysts read every response individually.
Zero-shot classification allows you to define a set of themes without any training examples and have a language model assign responses to those themes. This is useful when you are analyzing a new product area or a feedback dataset you have not seen before, because you do not need to pre-tag hundreds of examples to get started.
AI-assisted thematic analysis uses large language models to propose initial theme structures from a raw feedback corpus, which analysts then review, merge, and validate. This hybrid approach retains human judgment on theme definition and interpretation while eliminating the mechanical read-through step that consumes most of the time in manual coding.
These methods are increasingly available within commercial feedback tools, and some teams build lightweight pipelines using general-purpose AI APIs for datasets their primary tool cannot handle.
The tradeoff in all three cases is the same: speed and scale in exchange for requiring human review of outputs before acting on them.
Qualaroo is one such tool with Sentiment Analysis to automate your customer feedback analysis. It analyzes all the survey responses and displays the emotional score by detecting different emotions like joy, frustration, anger, etc.
Here’s how it works:
To make feedback analysis actionable, build 2–3 simple dashboards that answer: What’s happening? Why? What should we do next?
| Dashboard | What it shows | Key filters / components | Example insight → decision |
|---|---|---|---|
| Theme Volume + Trend Dashboard | Top themes (e.g., Pricing clarity, Onboarding confusion) by week/month | Channel (in-app, email, reviews), segment (plan, persona) | Pricing clarity is spiking this month → prioritize pricing-page rewrite |
| Sentiment + Verbatim Drilldown Dashboard | Sentiment trend by theme + the language customers use | Most common phrases; clickable list of representative responses | Frustration concentrated in onboarding step 2 → fix copy/UI there first |
| Outcome Impact Dashboard | Theme mapped to key outcomes | Conversion, churn, tickets, CSAT/NPS | Users mentioning “plan confusion” convert lower → A/B test plan labels + comparison layout |
| Operational follow-through (AI/Sentiment workflow) | Negative/emotional feedback routed into action | Tag negative-emotion responses; convert to tickets via helpdesk | High-frustration responses → create tickets, prioritize fixes, close the loop |
Automated sentiment analysis is a significant time-saver at scale, but it has documented limitations worth knowing before you treat its outputs as ground truth.
Sarcasm and irony are routinely misclassified. “Oh great, another update that breaks everything” will often score as positive because of the word “great.”
Mixed-sentiment responses are common in long-form feedback. A customer who says “the onboarding was excellent, but billing is a nightmare” may be scored as net positive or net negative, depending on the tool, when the correct reading is: two separate signals requiring two separate actions.
Short responses often lack enough context for reliable classification. Single-word or single-phrase responses, which are common in post-interaction surveys, can produce low-confidence scores that skew aggregate sentiment metrics.
Industry-specific language trips up generic models. In technical SaaS, legal, medical, or financial contexts, domain vocabulary may be scored incorrectly because the model was not trained on that language register.
The Practical Implication: Use automated sentiment to triage and prioritize, not to replace human review on responses that will drive significant decisions. Always sample-check a portion of machine-classified outputs, especially when a sentiment trend looks surprising.
You can tag responses portraying negative emotions and turn them into tickets using any helpdesk tool. This way, you’ll be able to help unsatisfied customers and act on the feedback.
If you are a mid-sized or large company that wants to automate feedback analysis and procure qualitative insights, here’s a video for you to choose your customer feedback tools:
Case Study: Belron
Belron used Qualaroo’s Sentiment Analysis to comb through open-ended responses and was able to identify high-risk customers along with patterns and themes in the feedback.
It is a company that offers windshield services and faces a high bounce rate, despite its visitors being one-time customers in need of fixing the windshield.
The team wanted to understand the needs of visitors who left without purchasing to understand what’s missing from the website that they need.
They launched exit-intent pop-up surveys on the website and analyzed the responses with the AI analysis. Resultantly, Belron not only reduced its bounce rate but also identified new buyer personas.
A Simple End-to-End Example (Feedback → Insight → Decision)
Say your SaaS has plenty of trial sign-ups, but upgrades are stuck.
- You launch two in-the-moment surveys with a tool like Qualaroo: one after onboarding (“What’s unclear so far?”) and one on the pricing page (“What stopped you from upgrading today?”).
- Responses are tagged into a small taxonomy: Onboarding, Pricing clarity, Missing feature, Trust/Security, and Support.
- Qualaroo’s sentiment analysis highlights emotion-heavy responses (frustration/confusion) so you don’t miss high-risk feedback.
- Your dashboard shows: “Pricing clarity” appears in 38% of pricing-page responses, and those visitors convert significantly lower than visitors who don’t mention it.
- Decision: update plan comparison copy + add 3-line “best for” guidance + reduce fields on checkout.
- Ownership: marketing updates pricing page; product updates checkout; support gets a macro for plan questions.
- You re-run the same surveys for 2 weeks to confirm the impact and close the loop with customers.
FREE. All Features. FOREVER!
Try our Forever FREE account with all premium features!
Dos and Don’ts of Customer Feedback Analysis
After covering the enormous grounds of how to analyze feedback data, let’s move to discuss some customer analysis best practices.
Don’t Ignore The Neutral Feedback
Businesses often focus so much on the positive, negative, and actionable feedback that they overlook the neutral one. This kind of feedback can help you identify if customers are engaging enough with your brand, if you need to update some features, etc.
Ask Customer at the Right Time for Accurate Feedback
Customer feedback analysis can help you only if your data is valuable and accurate. Asking customers the right questions at the right time is key to a successful customer feedback data analysis.
For example, if you want to collect feedback from customers leaving your website, then the right time would be to show your pop-up survey when they are about to leave and not before then.
Another example, you’ll not require feedback on your customer support from new customers, but their feedback on the onboarding process will be helpful for your business.
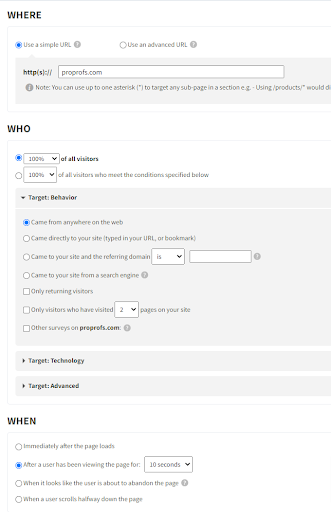
You can leverage advanced targeting functionality and set parameters for targeting customers based on where they are coming from, their online behavior, the device they use, their location, and more.
By setting these parameters, you can control where, when, and to whom you show specific surveys.
Prioritize What to Fix, Not Just What to Find
Categorizing and tagging feedback is not the endpoint. The harder decision is what to act on first. Without a prioritization method, teams default to whichever theme was raised most recently or most loudly, which is rarely the highest-value fix.
Three frameworks teams commonly use:
Frequency × Severity Scoring: Score each theme by how often it appears and how severe the impact is on the customer (expressed as churn risk, support volume, or satisfaction drop). Themes that score high on both dimensions go to the top of the fix list regardless of which team raised them.
Impact vs. Effort Matrix: For each high-priority theme, estimate the business impact of fixing it (retention, conversion, ticket deflection) against the implementation effort. High-impact, low-effort fixes ship first. High-impact, high-effort items go into roadmap planning with a defined owner.
Driver Analysis: Identify which feedback themes most strongly correlate with changes in your key outcome metrics, such as NPS score, churn rate, or conversion rate. A theme that appears frequently but has no statistical correlation with any outcome metric is lower priority than a less frequent theme that consistently precedes churn.
The goal is to move from “customers say X is a problem” to “fixing X is estimated to reduce churn by Y% based on the correlation between that theme and churned accounts in the last 90 days.”
That is the level of specificity that gets feedback analysis taken seriously in product and engineering planning.
Use Incentives to Bump up Response Rate
No customer feedback analysis method will work as you want if you don’t have adequate data to begin with.
So, how can you ensure you get enough feedback data to conduct customer feedback data analysis?
Offering incentives for surveys is a great strategy that you can try. It motivates the website visitors and gives them a reason to spend their time offering feedback.
Incentives such as time-sensitive deals, discounts, gift coupons, or free access to premium features for some time are great motivators.
Tools like Picreel are perfect for creating engaging and interactive popups showing discounts and deals you offer.

Customer Feedback Analysis: Challenges And Their Solutions
Since we’ve already discussed the best customer feedback methods for analysis and the best practices for feedback analytics, it’ll help if you know the challenges you might face in the process.
So, here are common and solvable challenges you may face during customer feedback analysis.
Feedback Quality
As discussed above, you will get two types of data: insightful and non-insightful. So, sorting through the heap of feedback to segregate the two is arduous.
But there is an easy way out — Customer feedback sentiment analysis.
As we explained above, you can categorize responses based on the vocabulary used in the feedback. This makes it easy to analyze the data as negative and positive feedback and find actionable insights.
Data Quality, Bias, and Representativeness
Even well-collected feedback data can mislead if its quality and representativeness are not assessed before analysis begins.
Sampling bias occurs when the customers who respond are systematically different from those who do not. Highly satisfied customers and highly dissatisfied customers are both more likely to respond than customers in the middle. This means your feedback pool often over-represents the extremes of the experience distribution.
Vocal minority effects happen when a small, organized group (power users, community members, early adopters) contributes a disproportionate share of feedback. Their issues are real, but they may not represent the priorities of your median customer.
Duplicate and bot submissions inflate theme frequency counts and distort sentiment scores. Implement deduplication logic before analysis, particularly for surveys distributed via public links.
Confirmation bias in qualitative analysis is the tendency to notice and code feedback that confirms existing beliefs about what the problem is. Counter it by having at least one analyst approach the data without a prior hypothesis, or by using AI-assisted clustering to surface themes you were not looking for.
Low response rates introduce non-response bias: you cannot assume that customers who did not respond would have said the same thing as those who did. When response rates are below 15 to 20%, treat theme findings as directional hypotheses to be validated rather than confirmed insights.
Before drawing conclusions from any feedback dataset, document its known biases and note them in the analysis output so that stakeholders understand the confidence level appropriate to the findings.
Feedback Spread on Multiple Channels
Since you are representing your business on all the viable platforms, it’s tricky to collect scattered customer feedback in one place.
You have feedback from review websites, in-app, on-site, and social media, so how can you avoid making your feedback collection a hot mess?
For this, you can use customer feedback tools to collect feedback from different channels like email, social media, email embed, QR code, SMS, mobile SDK, etc., in one place.
For example, Qualaroo offers integrations with tools such as Power BI, Tableau, HubSpot, Zapier, and Mailchimp, so that you can better visualize and streamline your feedback data.
Categorizing Collected Feedback
One big obstacle in a smooth customer feedback analysis process is feedback categorization. With data coming in from all directions, it becomes crucial to categorize the feedback for meaningful analysis.
Sadly, not all analysis tools allow you to categorize and organize the collected feedback. But with the right feedback tool, you can label the feedback as you get it and assign it to respective teams to work on the actionable insights.
Not Enough Time (or Analysts) to Do This Consistently
When feedback volumes grow, teams collect faster than they can analyze—so insights arrive late (or never).
Shrink the workload. Standardize 8–12 themes, automate tagging/sentiment where possible (e.g., with Qualaroo), and review insights on a fixed cadence (weekly 30 minutes beats “someday”).
Messy Tagging Systems (Too Many Tags, Too Much Noise)
Tag sprawl kills analysis—20 people create 200 tags and nothing rolls up cleanly.
Use a simple hierarchy: Theme → Sub-theme → Root cause. Limit who can create new tags, merge duplicates monthly, and maintain a “tag dictionary” so everyone labels the same issue the same way.
Pushback on Negative Feedback
Teams sometimes dismiss detractors as “edge cases” or take feedback personally—so the real problems stay unfixed.
Treat negative feedback like risk data. Pair verbatims with counts/trends (e.g., “this showed up in 27% of responses”), and route it as a product/process problem—not a person problem.
Proving ROI (So Feedback Analysis Doesn’t Get Cut)
If insights don’t translate into measurable outcomes, feedback programs get labeled “nice-to-have.”
Tie each theme to one metric (conversion, churn, tickets, CSAT/NPS), track before/after for the change you shipped, and report a simple chain: Theme → Fix → Metric movement → $ impact.
3 Best Customer Feedback Analysis Tools In 2026
By now, you know everything you need for customer and market feedback analysis, so let’s jump straight into the customer feedback analytics solutions you’ll require in the process. Here are our top 3 picks for customer feedback analysis tools.
1. Qualaroo
Qualaroo is a customer experience tool that helps you collect in-context, qualitative, and quantitative insights. You can launch pop-up surveys on your website, mobile app, or prototype or share them via email links.
Qualaroo is an excellent choice as a customer feedback analysis tool because it helps you automatically segregate the feedback and analyze it for you.
Its advanced targeting feature lets you target customers with surveys based on different parameters such as visitors’ source browser, buyer persona, and much more. It also supports response tagging to categorize feedback.
You don’t have to worry about analyzing feedback manually, as Qualaroo facilitates the analysis of customer feedback through its advanced reporting feature.
It also has a sentiment analysis feature that will automatically analyze your survey responses to highlight essential feedback vocabulary and assign an emotional score to the feedback.
[Useful Read: Qualitative vs. Quantitative Research: How to Get the Best of Both Worlds]
2. Thematic
Another top feedback analysis tool is Thematic. The tool helps you centralize multi-channel feedback. It analyzes feedback from comments, phone calls, surveys, etc.
Although it doesn’t offer detailed survey development like Qualaroo, it comes with deep analytics.
You can also tag responses with Thematic to segregate and label your feedback. It offers integration with different tools like Intercom, Zendesk, Qualtrics, etc.
3. MonkeyLearn
If you specifically want a tool that can combine social media feedback and offer sentiment analysis, then MonkeyLearn is your pick.
It comes with MonkeyLearn API that integrates seamlessly with your business management system. With this API, you can design your analysis model with vocabulary specific to your business and industry.
Why Should You Analyze Customer Feedback?
Instead of advocating the importance of customer feedback analysis, let’s see the practical benefits of the feedback analysis for your business and why you should board this bandwagon.
Improved Customer Experience
Did you know that 49% of customers left a company in 2021 because of poor CX?
Now, that’s a concerning figure since it can mean thousands of customers churning away.
So, if you ever face such a situation, however unfortunate, there’s a perfect solution: Improving customer experience by listening to the voice of customers.
One of the effective ways to improve your CX is to ask the customers about their experiences, satisfaction level, and interactions at different touchpoints.
But is the job done by simply asking customers for feedback?
Nope!
You need to analyze the feedback data. You won’t believe the insights you can get to help you with customer experience management and offer delightful experiences. For example, you’ll know:
- If your customer journey map is optimized to lead the prospects into the sales funnel.
- If your onboarding process adds to the customers’ experience.
- What kind of brand image your business has on social media and other digital platforms.
- Whether you are offering proper support to your customers.
- Where you stand with your competitors in the market.
- What marketing strategies are or aren’t working for you, and so on.
Once you tread on this path, creating an impeccable CX won’t be difficult for you.
Boost Recurring Business
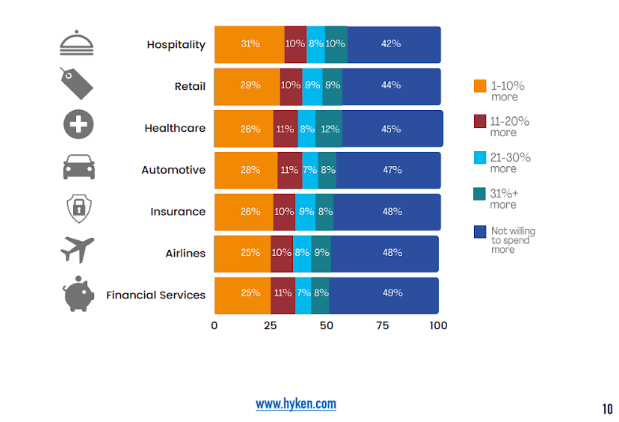
According to Customer Experience Expert Shep Hyken’s Customer Amazement Survey, across different industries, one in every four customers is willing to pay 10% more if they think they’ll receive a good customer experience with a brand.
This opens up a myriad of opportunities for your business to grow by ensuring you deliver a consistent and satisfactory experience to your customers.
So, even if you increase your prices, you can be assured of continuous revenue growth since you create loyal customers by delivering outstanding experiences with every interaction.
Improve Your Customer Satisfaction Metrics
Analyzing customer feedback also helps you keep track of your customer satisfaction metrics. These metrics tell you different things about your customers and their experiences.
For example, how satisfied are your customers (CSAT), are they loyal or not (NPS), is your product(s) easy to use (UES/CES), and so on.
These metrics are crucial for your business’s success since they tell you a lot about customer behavior and experience with your brand.
Watch: How to Measure Customer Satisfaction
Reduce Churn
Think about it: If you know what’s bothering your customers and making them leave your website or your business altogether, it would be so easy to fix things, right?
Well, it’s not going to happen if you just ask your customers and never listen to what they say, i.e., analyze the information they share.
So, analyze the feedback you get from surveys on your websites, such as exit-intent and post-churn follow-up surveys after customers leave your business.
The second type of survey feedback may not always help you regain the lost customers but will help you discover the reasons they left so you can take measures to reduce the churn rate.
Of course, during the feedback collection process, you’ll get all kinds of data; the challenge is distinguishing the gold (helpful feedback) from its ore (overall feedback data).
FREE. All Features. FOREVER!
Try our Forever FREE account with all premium features!
Start Making Data-Driven Business Decisions Now!
With the correct customer feedback analysis method, you can collect valuable insights that’ll help you make the right business decisions. The method you choose should offer both quantitative and qualitative feedback insights so that you can improve your overall customer experience.
Nonetheless, whatever method you choose, follow the best practices and ACT on the feedback. If you don’t act on the data, it’s all for nothing.
FREE. All Features. FOREVER!
Try our Forever FREE account with all premium features!

 We'd love your feedback!
What did you like & how can we make it even better?
 Thanks for your feedback!
 Ask Your Question
Have a question? Get expert help to make your decision easier.