

Here’s some juice to kickstart our conversation –
Did you know 35% of eCommerce small businesses’ revenue is generated by the top 5% of customers, i.e., loyal and repeat customers (customer acquisition enthusiasts can calm down)?
The question is, what drives repeat business? It’s obviously loyal customers.
That’s why businesses across industries are obsessed with tracking the Net Promoter Score (NPS).
It’s one of the most used CX metrics to gauge customer loyalty and how likely people are to recommend you.
It’s a strong loyalty signal, not a direct measure of satisfaction or a standalone predictor of churn, so it works best alongside CSAT, CES, retention data, and support trends.
The challenge is knowing how to get started. That’s where NPS benchmarks come in handy. You can estimate a good NPS score for your industry and guide your NPS program accordingly.
These numbers are guiding averages you can use to understand how much you need to improve to have an edge over your competition.
Simply put, NPS benchmarks answer a burning question: What is a good NPS score?
Because the answer is subjective to each industry and business, let’s understand what benchmarking is and how to set it up on your end.
Factors Affecting the Net Promoter Score (NPS) for an Industry
Before discussing the benchmark figures for different industries, we must clarify one thing: What’s considered a good NPS is relative and subjective. The NPS benchmark varies for each industry because of the following factors:
- Nature of the business, i.e., B2B, B2C, automotive, finance, education, retail, etc.
- Level of customer tolerance. For example, customers may be more tolerant of a bad website experience than a bad experience in healthcare.
- The difference in the target audience and customer personas.
- How often you track the NPS.
- Whether you have an omnichannel business model, i.e., online and offline (brick and mortar stores).
- The extent of customer service required in your industry.
The Methodology Behind the Number: Survey channel (email, in-app, phone), timing (right after onboarding versus after a support dispute), whether it’s relationship NPS (a periodic check-in) or transactional NPS (tied to one specific interaction), and how the scale was presented to respondents.
Two companies in the same industry can report very different scores purely because of how they measured it, not because one delivers a better experience.
Your Net Promoter Score should be a metric against which you measure your progress and not focus entirely on the competitive side of things.
Read Also: A Complete Guide To Website Surveys
Current NPS Benchmarking Data (2025-2026)
Here’s what recent, larger-sample studies show.
A caveat before the numbers: Both sources use different methodologies, survey channel mixes, and company samples, so treat cross-source comparisons as directional, not exact.
CustomerGauge’s 2026 Account Experience report put median B2B NPS at approximately 58.
Forrester’s 2025 research found NPS declined in 20 of 39 industry-country pairs tracked, a broader downward trend attributed to rising customer expectations and increased use of deflection-based support (chatbots that frustrate rather than resolve).
The consistent thread across all of these: comparing your raw score against a different industry’s benchmark, or against a benchmark built with a different methodology than your own program, tells you less than it looks like it does.
Use these figures to get a rough sense of where your industry sits, then anchor your real target to your own prior scores, measured the same way each time.
Inference: What Is a Good Net Promoter Score (NPS) for Your Business?
Now circling back to our question, “What is a good NPS score,” it’s safe to say that there is no one specific answer. But, you can still take an idea from the industry standards.
For this, we have compiled all the data from different reports and studies to guide your NPS program.
Here are the average and ‘good’ NPS score benchmarks from all the reports discussed above:
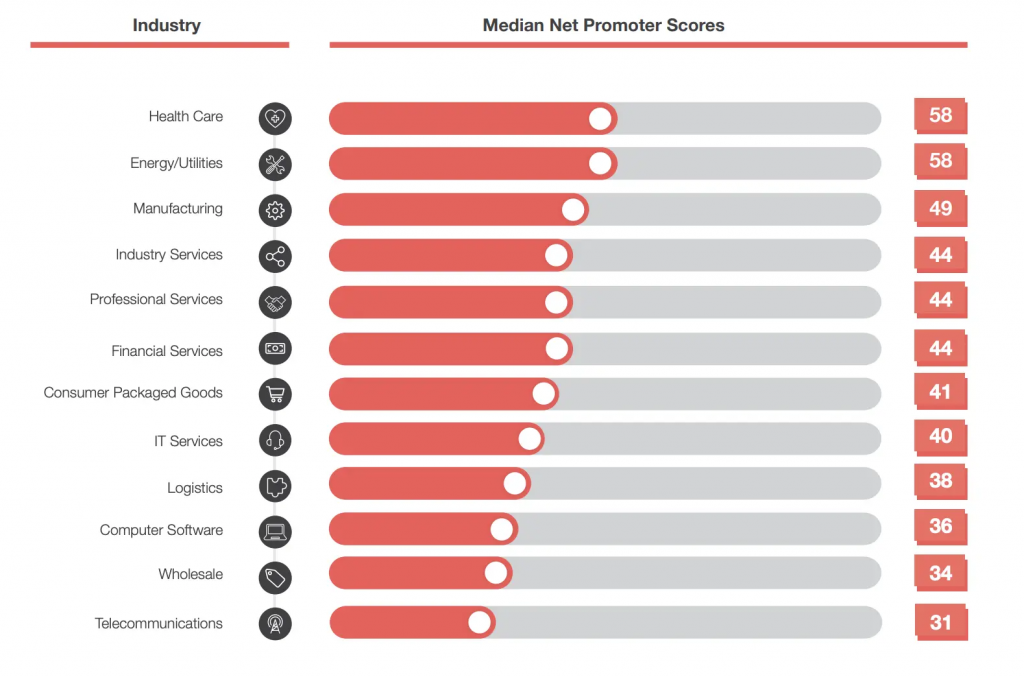
These are just a few benchmark examples for industries. You can use these good NPS score averages to understand where you stand currently and what you can do to achieve a good NPS in your industry.
Now, the challenge is, how do you know where you stand? That’s the question for our next topic.
4 NPS Benchmarking Methods to Tell Good NPS Score From Bad
Let’s dive straight into how you can determine whether you have a good NPS score or a bad one. Once you have the numbers, you can design strategies to improve upon it
Absolute NPS
It’s pretty much in the name. The absolute method uses unofficial industry benchmarks to determine what a good net promoter score is. For example, if you want to place your company’s NPS using the absolute method, refer to this scoring by Bain & Co.:
While any score above 0 is technically positive, scores above 50 are considered excellent, and scores above 80 are considered world-class. However, “good” varies heavily by sector, making industry-specific benchmarking crucial.
It’s evident that the distinction between scores is vague and leaves much room for improvement. Not to mention, the absolute method depends on several factors that can impact your absolute NPS. For example,
- Respondents may abandon the survey if it’s too long, leading to a low response rate.
- Survey errors may creep into the campaign, impacting the data quality.
- The sample size of the target audience you choose for the NPS survey.
- How regularly you measure the NPS.
- Whether or not you close the loop, i.e., follow up on detractors.
You cannot effectively measure your progress with absolute NPS since the scores are crammed together into one category.
Relative NPS
Relative NPS compares the competitors’ scores to create industry benchmarks and gives you a rough idea of where your competition stands. Plus, you can collect additional data on your NPS surveys to gauge the areas of improvement to deliver outstanding customer experience and improve your scoring.
Unlike absolute NPS, there is no such pre-categorization of scores since every industry is different.
For example, what is a ‘good’ NPS score will be different for an online marketplace business like Amazon, where it’s relatively possible to positively impact most customers compared to a Finance business dealing in loan approval.
Create Your Own Compass For ‘What Is a Good NPS’
No two businesses are alike, even in the same industry. So entirely relying on your competitors’ scores and treating them as a milestone for your company can be a setup for a disaster.
So, what are you supposed to do? Simple: Be your own competition. Collect and compare your NPS scores periodically to determine the good NPS score for your business.
You’ll be able to see the real improvement and how much the strategies you employed after the last NPS came to fruition.
A one- or two-point shift often falls within normal survey noise, especially if your sample size, response rate, or respondent mix changed between the two waves. Before treating a small uptick as real progress, check whether you surveyed a comparable group, with a comparable response rate, in both periods.
A meaningful improvement is one that holds up across a larger sample or repeats across more than one survey cycle, not a single point that could just as easily reflect who happened to respond that quarter.
It signifies that you are going in the right direction to offer impeccable customer experience and gain loyal customers.
And the only way to win against your last NPS is by acting on the insights it offers.
As Fred Reichheld said, “It’s not the score that matters; it’s what you do with it to make promoters that really counts.” So, don’t treat NPS as a vanity metric but as a tool you can leverage to create a loyal customer base.
Relate Your Good NPS Score with Revenue
It is possible to have a high and good NPS score which doesn’t translate into increased revenue.
For example, you may get a 60+ NPS, which is high for your industry standards. However, you discover that one of your biggest customers gave you a low rating turning into a detractor with fewer purchases.
So, although you enjoy a high NPS, you are on the verge of losing a crucial account. That’s why it’s a good practice to collect in-context feedback in your NPS survey to identify unhappy customers in time before they jump ship.
5 Best Ways to improve your Net Promoter Score With Qualaroo
You have set the benchmark and built a foundation to know your current standings. Now, it’s time to improve the NPS score. The first thing to do is to find a comprehensive NPS Survey Software. Using a tool like Qualaroo, you can take these steps to make your NPS program more effective.
Keep the Surveys Short & Relevant to Improve the Response Rate
The whole point of NPS surveys is to be quick and effortless.
That’s why this metric only consists of one question – “On a scale of 0-10, how likely are you to recommend our brand/products/services to your friends/family/colleagues?”

So, focus on collecting only the score and contextual feedback in your NPS surveys. You can use other surveys like customer satisfaction surveys, customer effort surveys, exit-intent surveys, first-impression surveys, etc., to explore customer satisfaction and experience in detail.
Read Also: 8 Tips to Improve SaaS Customer Experience In 2026
Put Contextual Feedback in Front Seat: Leverage Branching
There is only one purpose for collecting customer data: to gather actionable insights that lead to positive results.
The winning combination of qualitative and quantitative data can direct your actions on the right path.
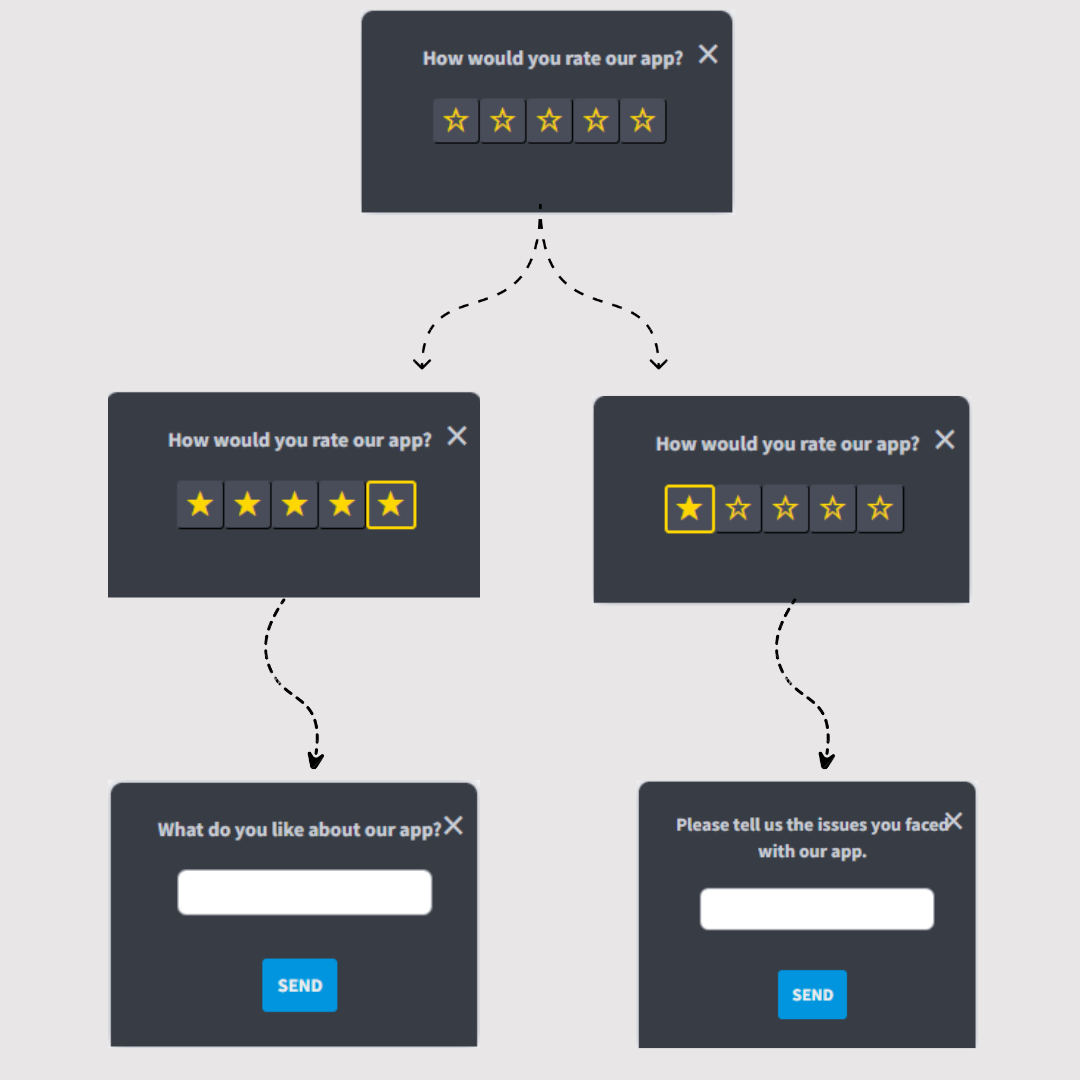
For example, asking a simple follow-up question like “Please explain the reason(s) behind your score” with your NPS question will tell you the whole story of each score and what exactly needs to be done to turn the tide in your favor.
Here’s how branching logic works and how you can implement it:
CASE STUDY: BELRON
Belron’s Safelite and Autoglass are the two brands that have become closely associated with automobile windscreens.
Its services are what Stephen Payne considers ‘typically a source of negative feelings for customers’ since they offer a replacement for broken windshields.
And so, as Jamie Carter, Voice of the Customer Manager, puts it, “The only way that we can continually provide [the easiest possible] experience is by understanding and internalizing what previous customers have told us.”
That’s where Belron seeks the help of Qualaroo’s surveys to ensure a high NPS and happy customers.
Time Your NPS Surveys Well
You cannot entirely rely on your NPS if you don’t get responses from most of your customers. Organizations may often get a low NPS, not because they don’t have promoters but because of the poor timing of their NPS surveys.
If you send your NPS survey via email, chances are the email will end up in the spam folder, get ignored, or customers might forget to respond, as the email can be lost in the pile of unread emails.
Well, a better way to do this is to embed your NPS survey in your product or launch it on your website and mobile app using a feedback survey tool like Qualaroo.
You can leverage advanced targeting to target customers for your NPS survey.
How?
Set triggers based on actions or customer behavior and show your survey at the most opportune moment to get maximum responses.
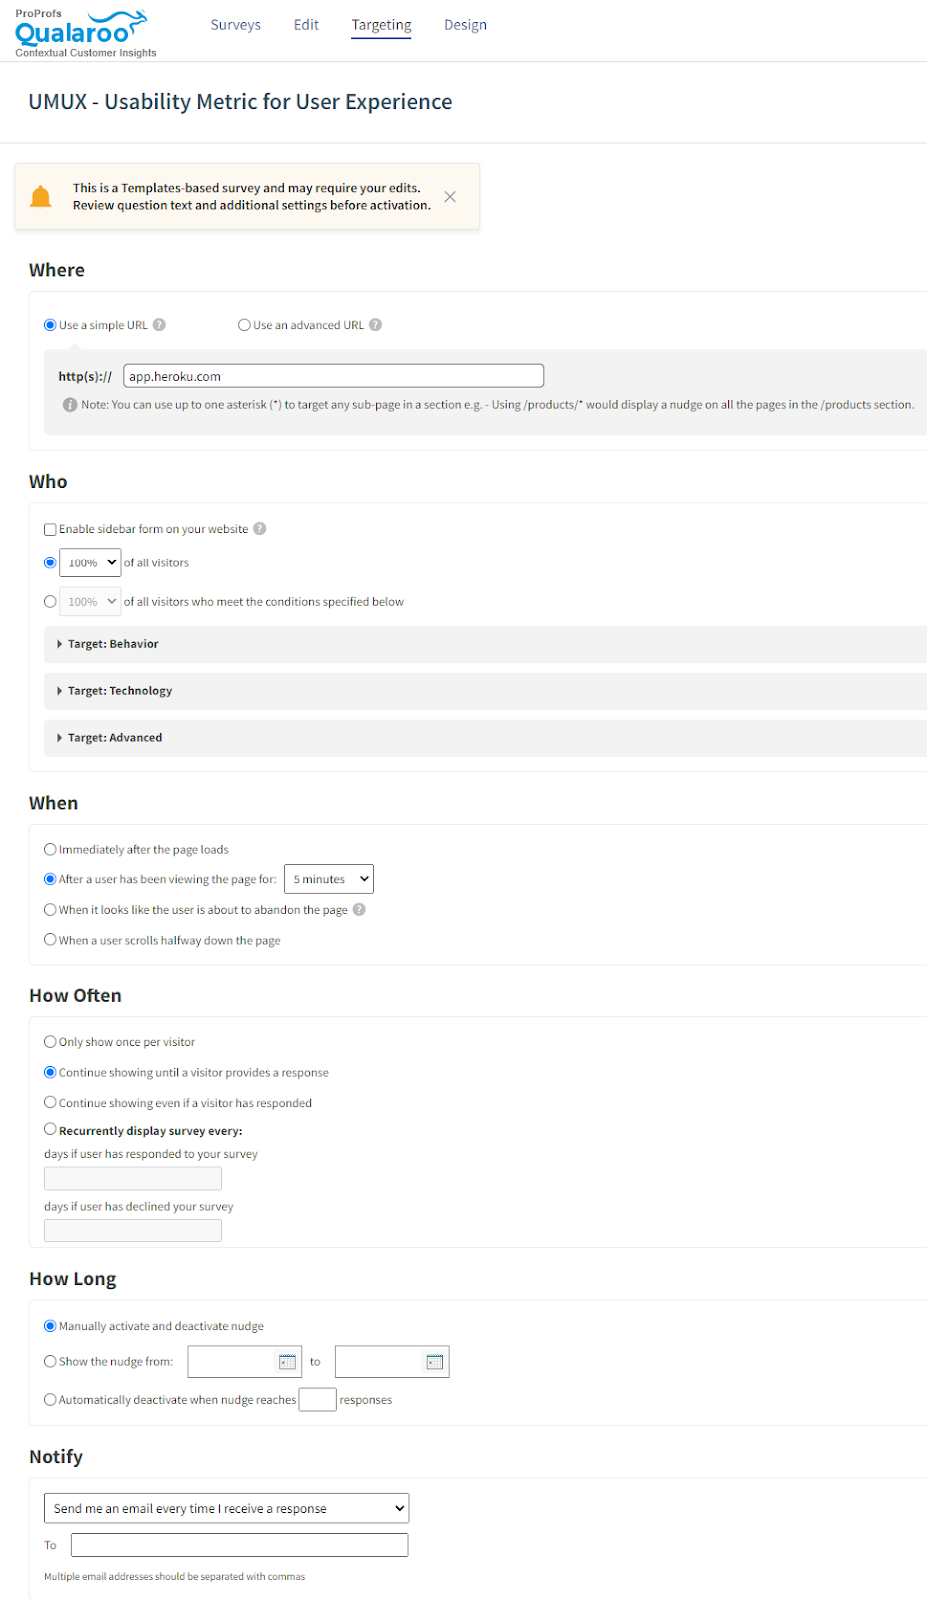
For example, you can set triggers to show your NPS surveys to those customers who have purchased from you, have successfully onboarded, and have been using your product/services for some time.
Read Also: Follow-Up Survey Email: How to Get More Responses in 2026
Leverage Automatic NPS Score Calculator With Advanced Reporting
Instead of managing multiple tools and manual methods to collect and manage your NPS scores across various channels, you can enjoy Qualaroo’s hassle-free, automatic NPS score calculator and visual dashboard.

It shows your score on the main dashboard and offers a detailed report of promoters, detractors, and passives. You can also see all the feedback responses from your open-text follow-up question in the same report.
This way, you can tag responses from detractors needing help and create support tickets using a tool like ProProfs Helpdesk to resolve the issues promptly.
See Beyond Your Numbers & Into Customer Emotions
To develop a holistic NPS program, you need deeper qualitative insights. For this, you need more than just collecting contextual feedback; you need the means to decipher what the feedback tells you.
That’s where Qualaroo’s IBM-Watson-powered Sentiment Analysis comes to save the day.
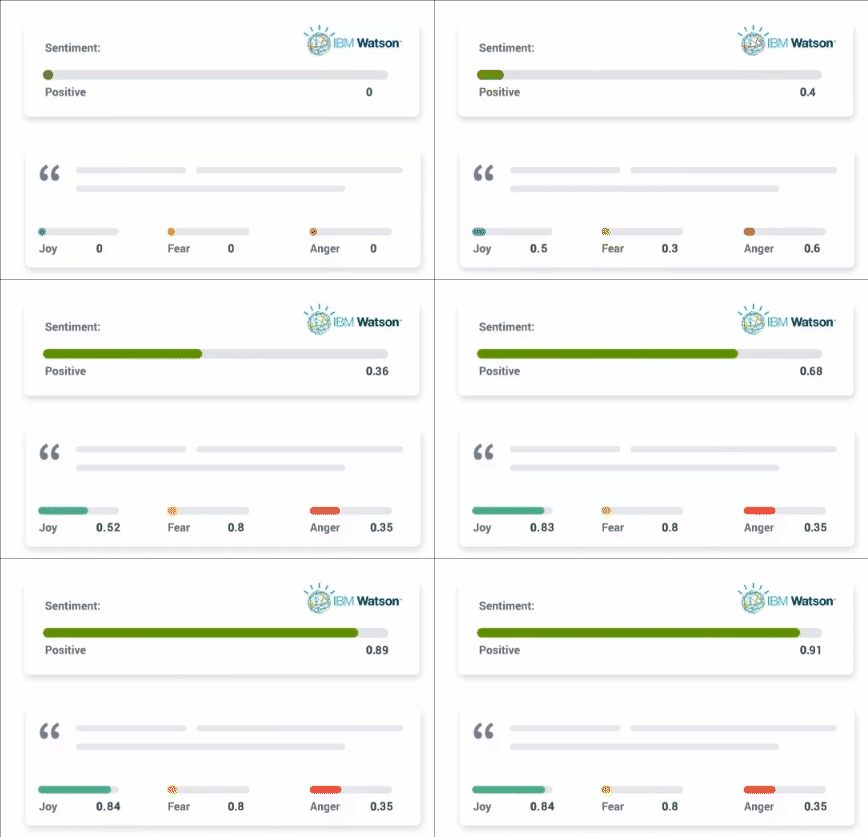
With this incredible feature, you can understand the overall sentiment of your promoters and detractors and uncover the factors affecting your NPS.

For example, the word cloud feature highlights key phrases and most used words in the feedback, so you know what most customers are talking about. The bigger the word, the more times it’s been used in the feedback.
This way, you can instantly identify the gaps in your customer experience and take proactive measures to improve your NPS.
FREE. All Features. FOREVER!
Try our Forever FREE account with all premium features!
Approach NPS Benchmarks With Care
We know now that NPS is not just a vanity metric but a catalyst for improving your overall customer and brand experience.
But the crux of this discussion is not just this; you should only strive to compete and compare your NPS with your previous score and no other.
Additionally, what your NPS shows might be one of many truths. You can have a low score but higher profits and vice versa.
So, it’s best to gain different perspectives, i.e., identify elements unique to your business, such as demographics, consumer behavior, habits, product offerings, customer tolerance, etc., to understand what your NPS is telling you about your customer experience.
One more thing worth remembering throughout all of this: NPS measures loyalty and likelihood to recommend, not satisfaction or churn risk directly. A customer can be satisfied with a single interaction and still be a detractor if the broader relationship feels shaky, or the reverse.
Pair your NPS trend with CSAT, CES, retention numbers, and support data before drawing conclusions about where your customer experience actually stands. Also, don’t get swept up by inflated NPS.
But the thing is, to get reliable NPS benchmarks, you need a bulletproof NPS strategy.
How and when you send NPS surveys can affect your score and benchmarks. For example, customers might give high scores if you collect your NPS over the phone through a representative.
We recommend experimenting with different NPS distribution channels and timings to find what works for your business.
For example, if you own both online and offline stores, you can use in-app and on-site NPS surveys for the online platform and a kiosk to collect offline NPS.
With the right approaches and reliable NPS benchmarks, you can surely make a mark in your industry and overshadow your competitors in NPS and exemplary customer experience.
Frequently Asked Questions
What is a positive Net Promoter Score?
A positive Net Promoter Score indicates that a company has a healthy relationship with its customers and has a reliable and loyal customer base.
What's the impact of location on NPS?
The responses to your NPS surveys can vary depending on the countries and regions where your customers are from. This happens because of the cultural differences that affect how people perceive and rate the surveys. So, location can have an impact on NPS results.
How does NPS benchmarking work?
In NPS benchmarking, you either compare and set an NPS standard based on your previous scores or you do the same using industry benchmarks from different sources.
FREE. All Features. FOREVER!
Try our Forever FREE account with all premium features!

 We'd love your feedback!
What did you like & how can we make it even better?
 Thanks for your feedback!
 Ask Your Question
Have a question? Get expert help to make your decision easier.